- Performance level or specifications
- Features or functions
- Specific hardware or methods
- Complaint solutions or failure mode prevention
- Lower prices, etc.
Similarly, customers may express desires for such things as speed, engine power, braking performance, roomy interior, and so forth for a new car. Often these requirements show up in customer surveys, focus groups, various marketing research and even in consumer magazines.
The problem is that what you get from these stated requirements are specifications, not "customer needs." People often confuse the two. The distinction is critical for successful new product development.
"The stated customer wants are only a starting point in design. What they said they want is the best guesstimate of what they think the producer could deliver," says Glenn Mazur, executive director of the QFD Institute. "In New Product Development (NPD), the goal should be creating the future experience and value for the customers."
This is how to better-understand this:

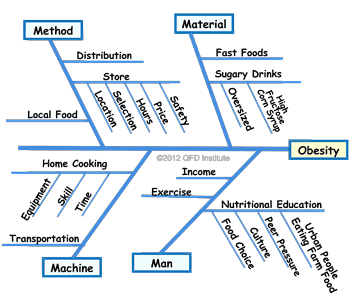
The relationship between the customer needs and what customers tell you is similar to a fishbone diagram, with needs representing the "head" or a desired effect, and the specifications, functions, components, materials, etc. representing the "bones" or causal factors.
Customers are experts in "heads" and producers are experts in "bones." When customers give your bones instead of heads, you get "bonehead specs" ☺ where the customer mistakenly thinks their stated specs will meet their unstated needs. Then. when the product is delivered, it fails to fit their use, and they scream.
In the above automotive industry example,
Classical QFD using a 4-phase model and House of Quality matrix would lump all of the customer-stated requirements together and attempt to prioritize the results. When you approach NPD that way, price and complaint issues dominate, and innovative product development gets inhibited.
Modern QFD, on the contrary, has specific tools for these:
- Identify what are product features and specs vs. what are customer needs
- Uncover 'unstated' customer needs
- Identify the unknown unknowns
- Determine what are 'true' customer needs (the foundation for highly competitive products)
- Set the needs priorities correctly
To truly build the "true customer needs" and innovation in your New Product Development, rather than the same old fixes of complaints and cost-pinching, we invite you to come learn the Modern QFD in the next public courses.
This advice also applies to those who have been doing Classical QFD for many years or learned the old QFD from books.